Recap: What is Data Science?
DS701 Session 2 — Wed Sep 9, 2026
Today’s plan
- ~30 min — ⚡ Spark pitches ⚡ (before this deck)
- 5 min — knowledge-check review
- 20 min — highlights and Q&A (answer or pass — answering always earns credit)
- 45 min — in-class activity (small groups): question types, then hands-on Pandas
- wrap-up and cold-call check-ins
Knowledge-Check Review
KC 1: The taxonomy
List the six question types from the lecture’s taxonomy (Leek & Peng), in order from least to most demanding, and for any three of them say in a few words what that type of question asks.
Answer: descriptive → exploratory → inferential → predictive → causal → mechanistic.
| Type | Asks |
|---|---|
| Descriptive | What does the data say, summarized? |
| Exploratory | What patterns are worth a closer look? |
| Inferential | Does the pattern hold beyond this sample? |
| Predictive | What will happen for a new case? |
| Causal | What happens if we intervene? |
| Mechanistic | Exactly how does the effect operate? |
KC 2: The churn model
A team builds a churn model with excellent held-out accuracy and notices that customers who received a discount rarely churn. They recommend launching the discount to everyone. Which question type was asked, which was answered, and why does the model’s accuracy not settle the matter?
Answer:
- Asked: causal — does the discount cause retention?
- Answered: predictive — who will churn?
- Each type has its own standard of evidence: prediction is judged by held-out accuracy; a causal claim by whether confounding is controlled.
- Discounts may have gone to customers who were already loyal (or already at risk) — “discounted customers churn less” can be pure association.
- Excellent prediction can be worthless causal evidence. This is the lecture’s type error.
KC 3: Your own question
Pick one question you would like to answer with data — from your own background, or anything you are curious about. State the question in one sentence, classify it using the taxonomy, and name the row of the lecture’s techniques map (“You want to… / Technique”) you would reach for first, with one sentence on why that row fits.
No single answer — but here is the shape of a good one:
- “Which of our support tickets are about the same underlying problem?” → exploratory (structure, no labels) → Group similar things, no labels → k-means / hierarchical / GMM, because nobody has told us the categories in advance.
- “Will a new applicant repay a loan?” → predictive → Predict a category → trees, k-NN, logistic regression, because we have historical outcomes and care about accuracy on new cases.
Highlights
Data science in one line
Data science is the discipline of drawing defensible conclusions and making decisions from data, combining statistical reasoning, computation, and domain understanding.
- Statistical reasoning — what the data can and cannot tell you.
- Computation — the data rarely fits in your head, increasingly not on your laptop.
- Domain understanding — otherwise you confidently answer the wrong question.
Drop one and the result has a name: stats without computation is small; computation without stats is confident nonsense; both without domain understanding is a solution in search of a question.
First, classify the question
Before choosing a technique, classify what kind of question you are asking (after Leek & Peng, Science 2015):
| Question type | Asks | Example |
|---|---|---|
| Descriptive | What does the data say, summarized? | Average ride time by hour |
| Exploratory | What patterns are worth a closer look? | Riders cluster into commuter/leisure groups |
| Inferential | Does the pattern hold beyond this sample? | Do commuters in general ride longer in rain? |
| Predictive | What will happen for a new case? | Will this user churn next month? |
| Causal | What happens if we intervene? | Does the discount cause retention? |
| Mechanistic | Exactly how does the effect operate? | Through which pathway does the drug act? |
Methods: Descriptive and Exploratory
1. Descriptive — summarize this dataset, without generalizing beyond it.
- Summary statistics: mean, median, variance and standard deviation, percentiles, counts and proportions.
- Aggregation:
groupbyand pivot tables — the Pandas half of today’s activity. - Plots of the data itself: histograms, bar charts, box plots, heat maps.
2. Exploratory — find structure worth a closer look; generate hypotheses.
- Clustering: \(k\)-means, hierarchical clustering, Gaussian mixture models — groups without labels.
- Dimensionality reduction: SVD, PCA, t-SNE — make high-dimensional structure visible.
- Similarity structure: distance and similarity measures, correlation matrices, pair plots.
Methods: Inferential and Predictive
3. Inferential — does the pattern hold beyond this sample?
- Estimates with uncertainty: confidence intervals, the central limit theorem, the bootstrap.
- Standard tests: \(t\)-tests and \(\chi^2\) tests, from your statistics prerequisite.
- Regression as estimation: coefficients with standard errors and \(p\)-values — not as a prediction machine.
4. Predictive — minimize error on unseen cases; accuracy, not explanation.
- Regression and classification: linear and logistic regression, Ridge and LASSO, decision trees, \(k\)-NN, naive Bayes, SVMs.
- Ensembles and networks: random forests, gradient boosting; MLPs, and transformers for text.
- Validation — what makes it predictive: train/test splits, \(k\)-fold cross-validation, ROC-AUC, precision/recall, RMSE.
Methods: Causal and Mechanistic
5. Causal — effect of an intervention, with confounding controlled.
- Experiments: randomized controlled trials and A/B tests — the gold standard, when you can run one.
- Observational designs: difference-in-differences, regression discontinuity, instrumental variables.
- Adjustment and structure: propensity score matching; DAGs and the backdoor criterion, to decide what to control for.
6. Mechanistic — the exact process and equations driving the system.
- Not covered in DS701: differential-equation models, simulation, agent-based models — the tools of physics, epidemiology, pharmacokinetics.
- It is in the taxonomy so you can recognize a question that needs a model of the process, not of the data.
Question Analysis Flow Chart
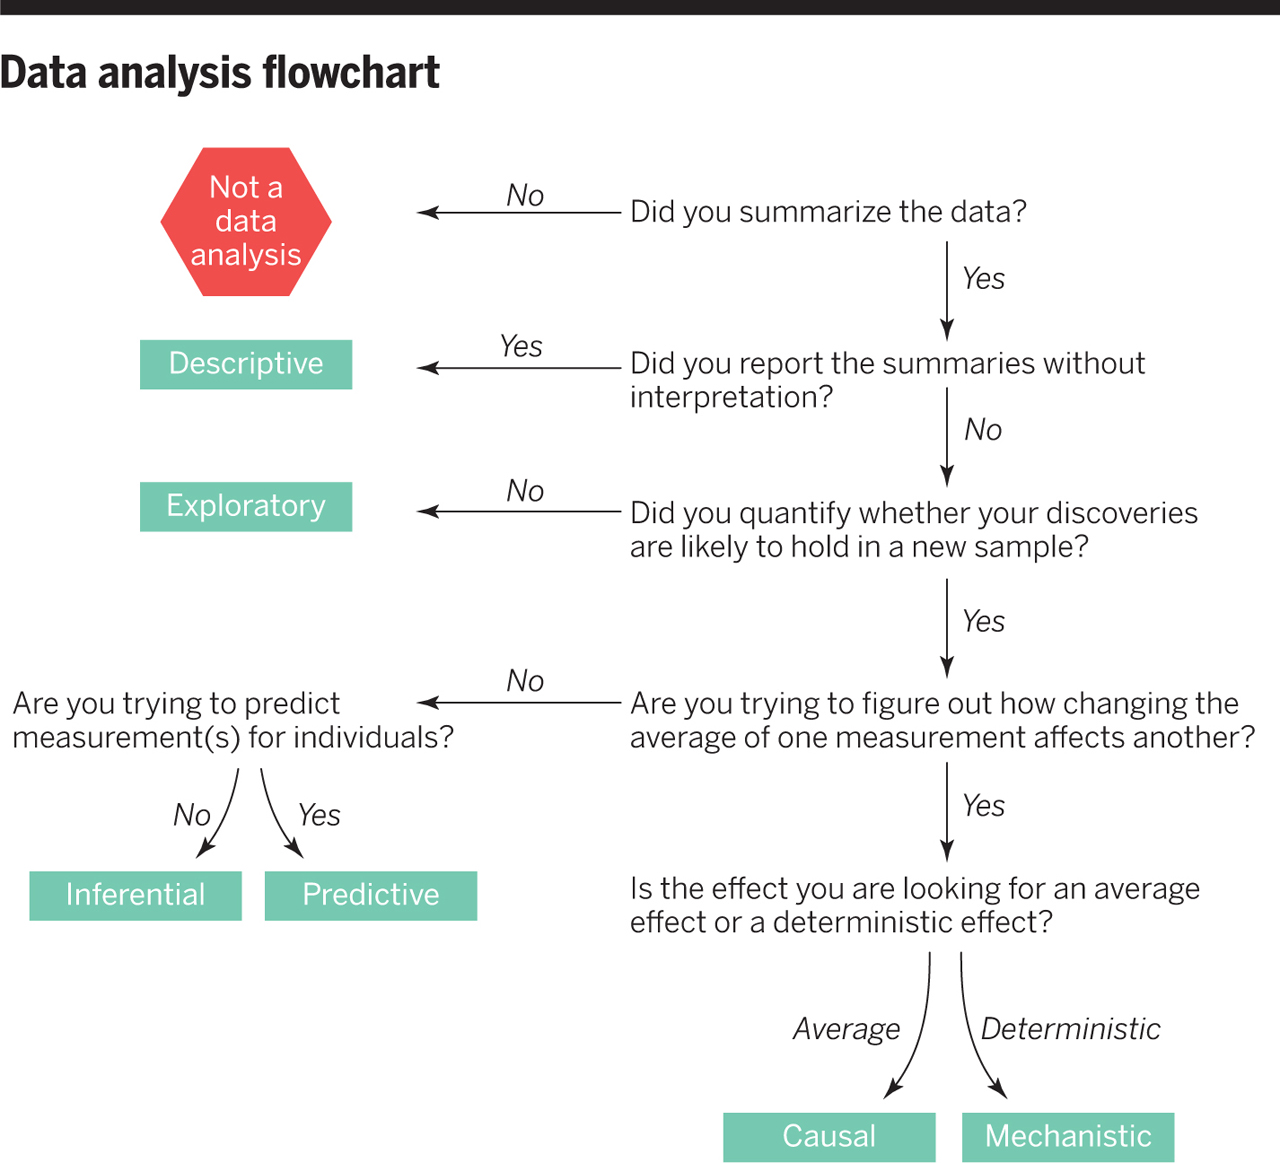
Type errors are the common failure
- Most real analyses fail not on the math but by answering a different type than was asked.
- The classic: a causal question (“should we launch the discount?”) answered with a predictive model (“churners tend to lack discounts”).
- Each type has different standards of evidence — held-out accuracy for prediction, controlled confounding for causation. Being excellent at one says nothing about the other.
- The same data can support a descriptive claim, hint at an exploratory one, and be silent on the causal one. Say which you are making.
- The prediction/causation gap gets its own session (S18). Keep the distinction in mind from today — the first half of the activity is a drill on it.
The lifecycle is a loop
Every project cycles through roughly six stages — rarely in a straight line:
- Frame the question — with the stakeholder, in their terms; classify it; decide what “good enough” means before modeling.
- Acquire the data — the least glamorous and most decisive stage.
- Clean and explore — plots before models, always. Expect half the effort here.
- Model — the simplest technique that answers the question type.
- Validate — held-out evaluation, sanity checks, error analysis. The stage that separates analysis from wishful thinking.
- Communicate and deploy — if nothing changes, the project did not happen.
Stage 3 is what the second half of today’s activity practices: read, inspect, filter, group, plot — in Pandas.
The techniques map: this course in one table
| You want to… | Technique | Sessions |
|---|---|---|
| Group similar things, no labels | k-means, hierarchical, GMM | 4–7 |
| Say how alike two things are | distance & similarity measures | 3 |
| Predict a category | trees & random forests, k-NN, logistic regression | 9–13 |
| Predict a number | linear regression + regularization | 12–14 |
| Compress / de-noise / visualize high-dimensional data | SVD, PCA, t-SNE | 15–16 |
| Ask “did X cause Y?” | causal graphs, effect estimation | 18 |
| Learn from raw signal (images, text) | neural networks | 19–20 |
| Work with language | NLP pipeline, embeddings | 21 |
| Recommend items to users | matrix-factorization recommenders | 22 |
| Reason about connected data | graph analysis, centrality, communities | 23–24 |
Each row answers a type of question. In the last session of the semester you fill in a blank copy from memory, with one sentence per row on why — a rehearsal for every data science interview you will sit.
In-Class Activity
Activity: Question types, then Pandas
Goal: (core) classify ten short scenarios by question type and spot a type error; (stretch) load a small real dataset (Titanic passengers) in Pandas and walk the clean-and-explore stage — read, inspect, filter, groupby, plot — then say which question type your groupby result actually answers.
- Work in groups of 2–3. ~45 minutes today.
- Parts marked (autograded) are submitted to Gradescope; the rest is participation.
- Staff will circulate — be ready to explain any part of your work.
- Dependencies:
pandas,numpy,matplotlibonly. - Pandas is new to some of you: the Pandas tutorial is the reference; the notebook links the sections you need.


The activity notebook goes live on the day of the lecture. Colab is optional — you can also open it on GitHub and run it locally.
Going deeper
Full lecture notes: What is Data Science?
- A working definition — the three ingredients
- First, classify the question — the taxonomy, with examples
- The taxonomy is not academic — type errors and standards of evidence
- The lifecycle of a data science project — the six-stage loop
- Two cultures, one practitioner — understand vs. predict
- Types of data science roles — where each job sits on the taxonomy
- The techniques map — print it
- Pandas tutorial — reading, inspecting, filtering,
groupby, plotting - Next up: distances and similarity (02) — the row half the map is built on.