Recap: Linear Regression
DS701 Session 12 — Wed Oct 14, 2026
The model, the residual, the objective
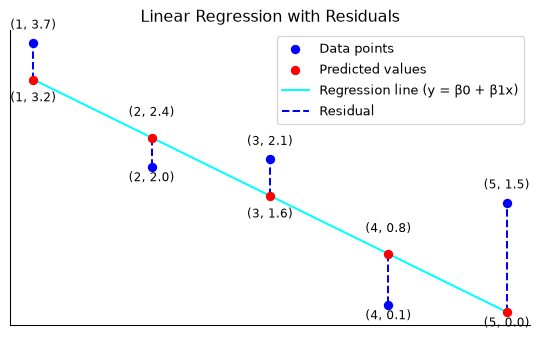
- Model: \(y = \beta_0 + \beta_1 x + \epsilon\) — a line plus a residual.
- Stack the \(n\) equations: \(\mathbf{y} = X\beta + \boldsymbol\epsilon\), with \(X = [\mathbf{1},\ \mathbf{x}]\) the design matrix.
- No \(\beta\) makes \(X\beta = \mathbf{y}\) exactly — so we ask for the \(\beta\) that makes them closest: \[\min_\beta \ \sum_i \epsilon_i^2 = \min_\beta \ \lVert X\beta - \mathbf{y}\rVert^2 .\]
- The sum of squared residuals is a squared distance. That single sentence is why linear algebra solves regression.
Least squares is a projection
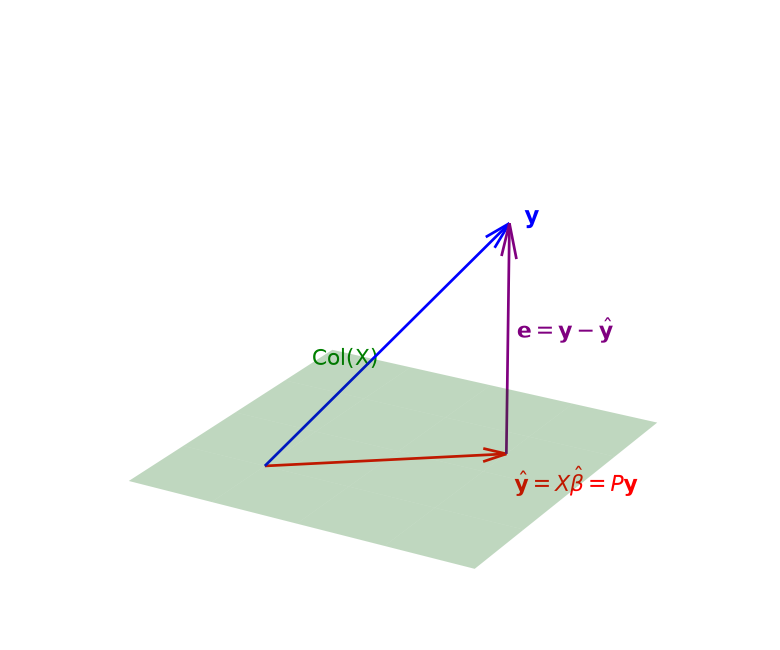
- \(X\beta\) ranges over the column space of \(X\). The closest point to \(\mathbf{y}\) in that space is its orthogonal projection \(\hat{\mathbf{y}}\).
- So the residual \(\mathbf{e} = \mathbf{y} - X\hat\beta\) is perpendicular to every column of \(X\): \[X^\top(\mathbf{y} - X\hat\beta) = \mathbf{0} \;\Longleftrightarrow\; X^\top X\hat\beta = X^\top\mathbf{y}.\] That is where the normal equations come from.
- Substituting: \(\hat{\mathbf{y}} = X(X^\top X)^{-1}X^\top\mathbf{y} = P\mathbf{y}\) — the projection (hat) matrix, symmetric, \(P^2 = P\), trace \(= p\).
- Two consequences you will verify today: residuals sum to zero (the \(\mathbf{1}\) column), and \(\text{TSS} = \text{RSS} + \text{ESS}\) (Pythagoras in \(\mathbb{R}^n\)).
Same equations, any design matrix
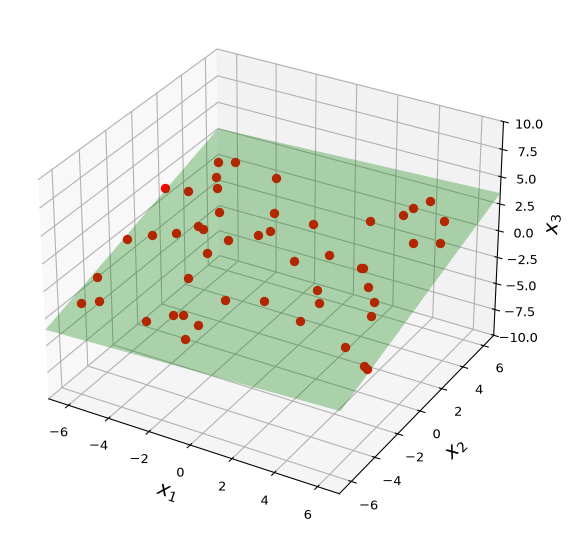
Once \(X\) is built, the procedure never changes:
| model | columns of \(X\) |
|---|---|
| line | \(\mathbf{1},\ x\) |
| parabola | \(\mathbf{1},\ x,\ x^2\) |
| log | \(\mathbf{1},\ \log x\) |
| plane / multiple regression | \(\mathbf{1},\ u,\ v,\ \dots\) |
| trend surface | \(\mathbf{1},\ u,\ v,\ u^2,\ uv,\ v^2\) |
“Linear” = linear in \(\beta\). Requirements for a unique \(\hat\beta\): full column rank (\(n \ge p\), no column a combination of the others) — otherwise \(X^\top X\) is singular and the coefficients, though not the fit, are undetermined.
Reading the answer: \(R^2\) — and its limits
\[R^2 = \frac{\text{ESS}}{\text{TSS}} = 1 - \frac{\text{RSS}}{\text{TSS}} \in [0, 1]\]
- Fraction of the variance of \(y\) the model explains. Not Pearson’s \(r\).
- Never decreases when a column is added → in-sample \(R^2\) cannot choose between models.
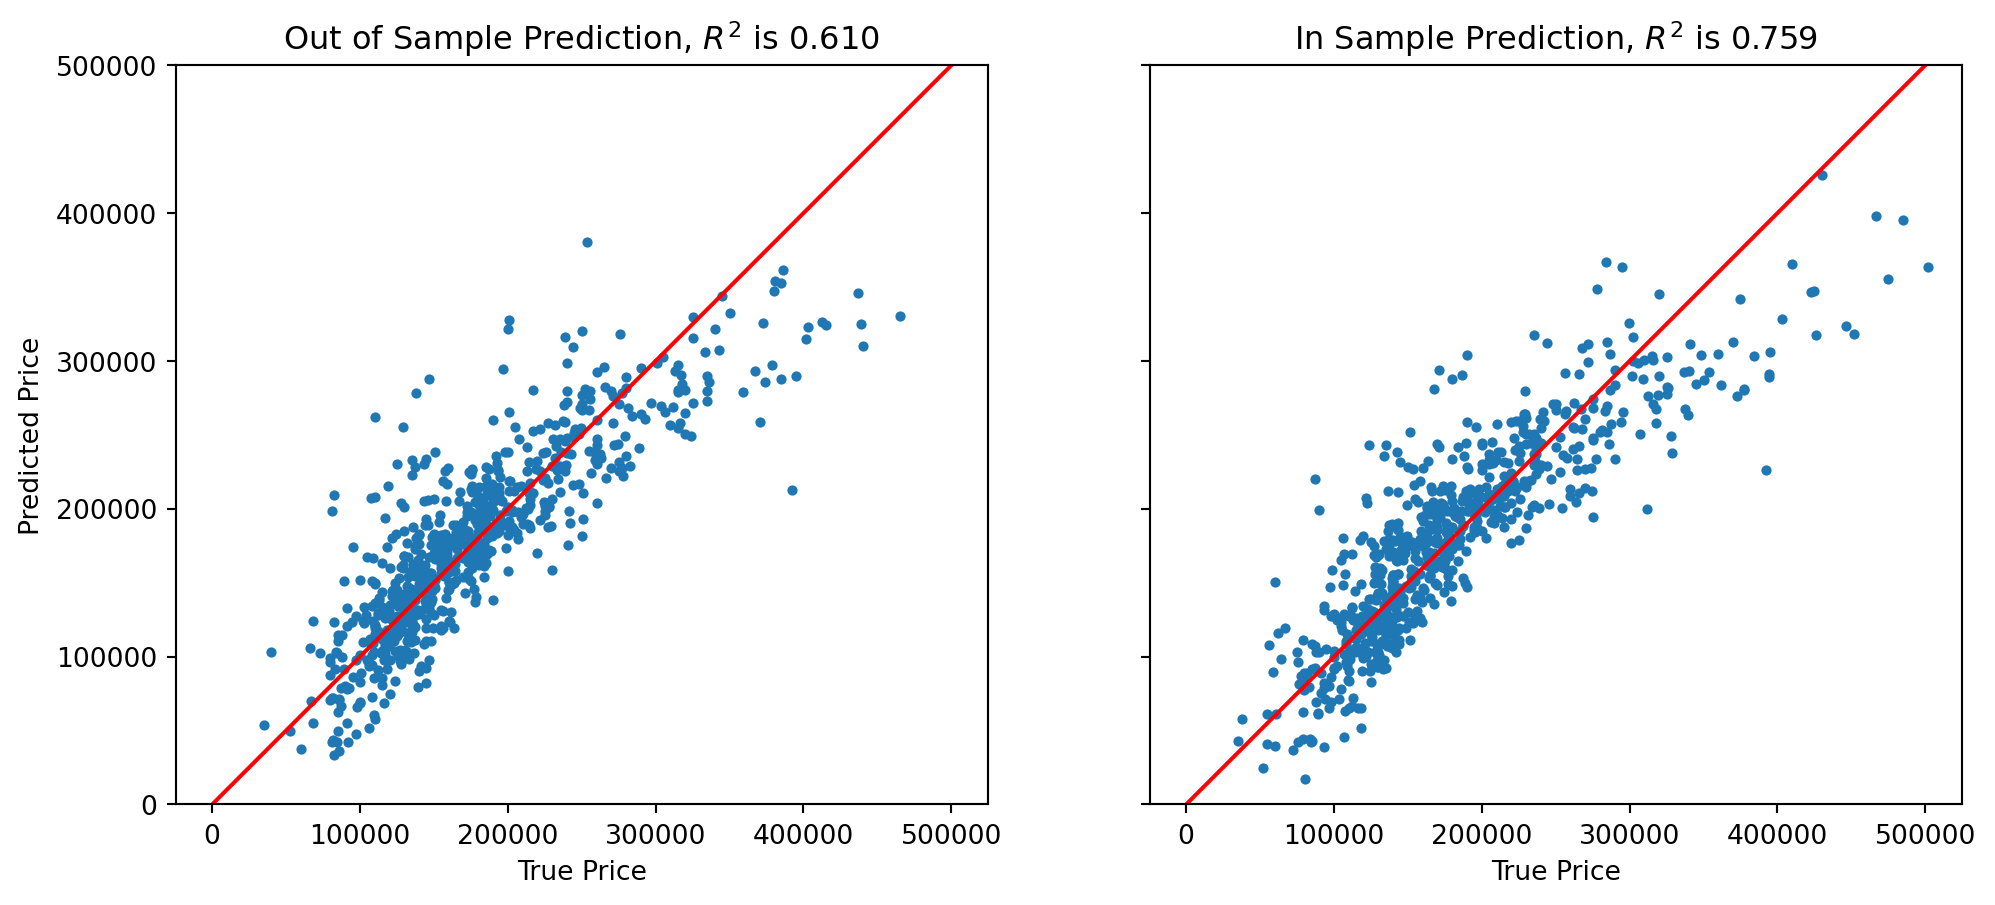
- Honest number: \(R^2\) on held-out data (0.61 vs 0.76 here).
- And look at the picture: predictions bend away from the diagonal at both ends. \(R^2\) did not tell you that — the residuals did.
The diagnostic habit: plot the residuals
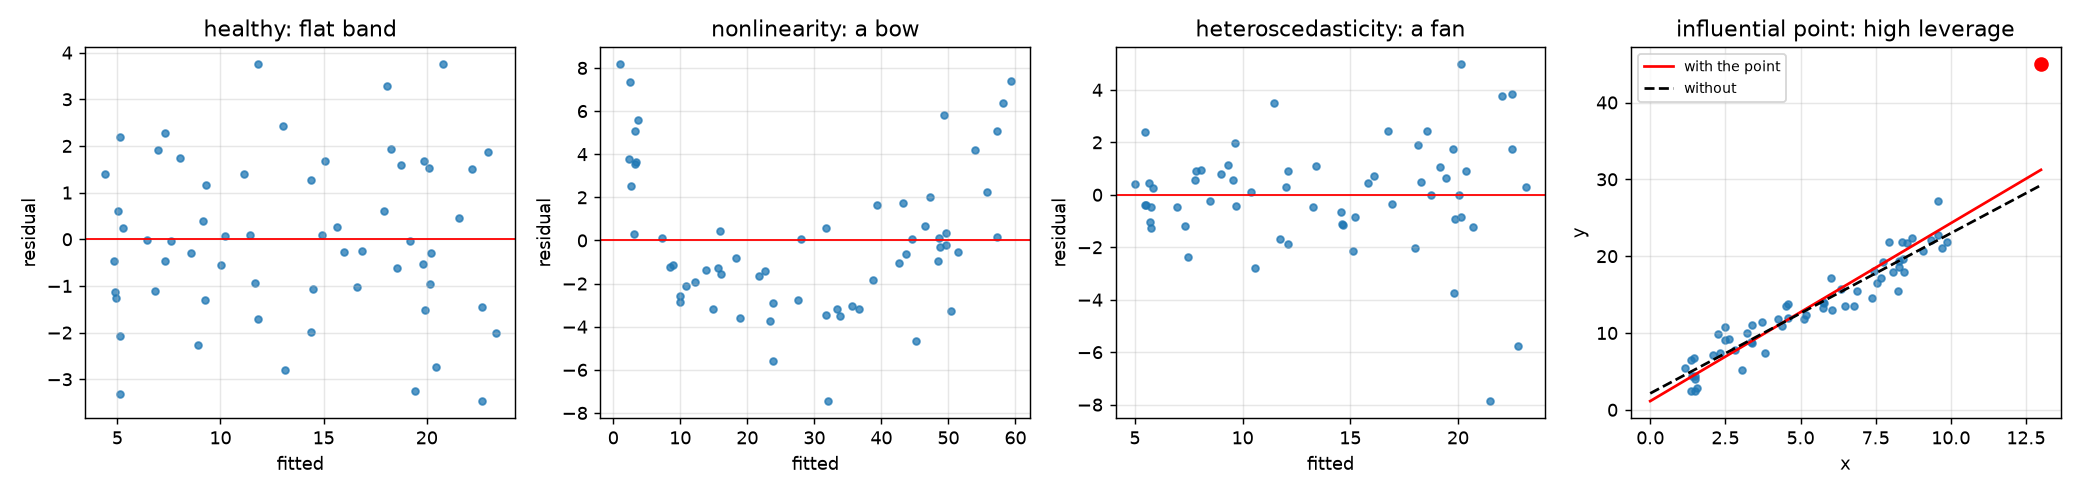
- \(\hat\beta\) and \(R^2\) are computed assuming the model. Only the residuals test the assumption.
- Residuals vs fitted should be a flat, even band. A bow = a missing term (nonlinearity). A fan = spread grows with the fit (heteroscedasticity). One point far out in \(x\) = high leverage — it can tilt the whole line and fake the other two patterns.
- Leverage is \(P_{ii}\), the diagonal of today’s projection matrix — the linear algebra and the diagnostics are the same object.
- Today’s stretch: a dataset with one hidden problem. Name it, fix it, say what the fix cost.
Activity: least squares by hand, then read the residuals
Goal: on a real dataset (200 diabetes patients — your section’s own subset), build \(X\) with an intercept, solve the normal equations, verify against lstsq and scikit-learn, compute \(R^2\); form the projection matrix and check the residual is orthogonal to the columns; add a correlated feature and watch the coefficients move. Then the stretch: a diagnostics function, a mystery dataset with a hidden problem, and the fix.
- Work in groups of 2–3. Open your section’s notebook.
- Parts marked (autograded) are submitted to Gradescope; the rest is participation.
- Staff will circulate — be ready to explain any part of your work.
- Dependencies:
numpy,pandas,matplotlib,scipy,scikit-learn.
Section A1 

Section B1
The activity notebook goes live on the day of the lecture. Colab is optional — you can also open it on GitHub and run it locally.