Recap: Logistic Regression
DS701 Session 13 — Mon Oct 19, 2026
Logistic regression = a linear model + a sigmoid
Last lecture: a continuous \(y\) as a linear function of \(x\). Today: a 0/1 \(y\), and we want a probability.
- A line takes values in \((-\infty,\infty)\); a probability lives in \([0,1]\). So fit the line to something unbounded: the log-odds \(\log\frac{p}{1-p}\) (the logit).
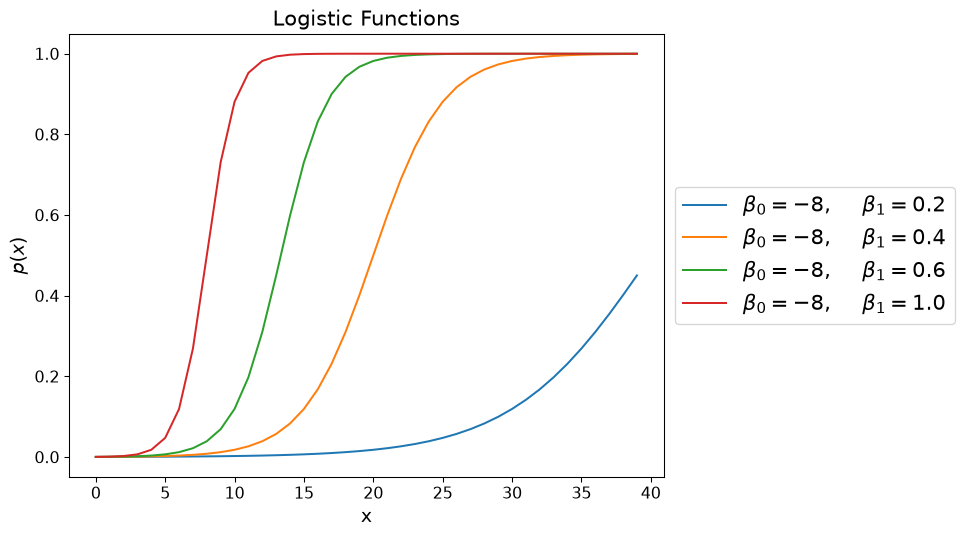
- Sigmoid: \(p(y{=}1 \mid x) = \sigma(\beta_0 + \beta_1 x)\).
- \(\beta_1\) sets the steepness (and direction); \(\beta_0\) shifts the curve; \(p = 0.5\) at \(x = -\beta_0/\beta_1\); \(\beta_0\) is the log-odds at \(x = 0\) — the base rate only if the features are centred (admissions: \(\sigma(\hat\beta_0) = 3\%\) vs 32% admitted).
- Read a coefficient as in linear regression — but on the log-odds scale: \(e^{\beta_1}\) multiplies the odds per unit of \(x\) (GPA: \(\times 2.2\) per point).
Evaluation beyond accuracy
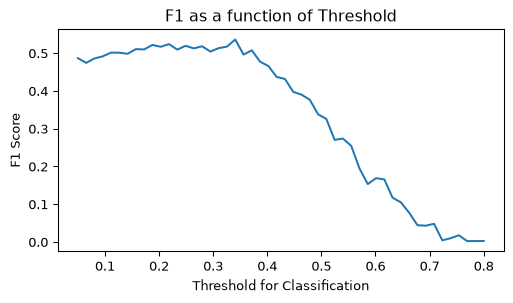
Admissions: F1 peaks near \(t \approx 0.35\) — the model rarely says “admit” at 0.5 because admits are the minority (and “always reject” is already 68% accurate).
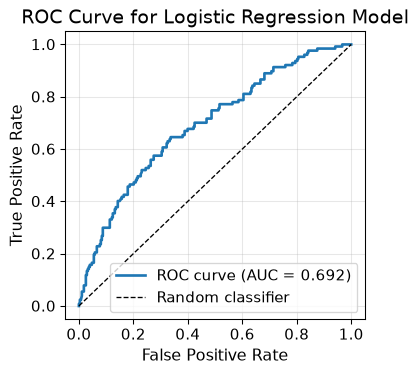
ROC: TPR vs FPR, one point per threshold; diagonal = random; AUC summarizes ranking quality without choosing a threshold (0.71 on the held-out split).
Activity — Logistics
- Work in groups of 2–3. Open your section’s notebook.
- Parts marked (autograded) are submitted to Gradescope; the rest is participation.
- Staff will circulate — be ready to explain any part of your work.
- Dependencies:
numpy,pandas,matplotlib,scikit-learn.


The activity notebook goes live on the day of the lecture. Colab is optional — you can also open it on GitHub and run it locally.